Title: Exploring Marginal Save Percentage and If the Canucks Should Trade a Goalie
Date: February 13, 2013
Original Source: Nucks Misconduct
Synopsis: My latest article at NM explored whether there is a gain in win expectancy for marginal gains in team save percentage.
It’s been a while. That snuck up on me. After three “debut” pieces priming advanced stats, I kind of got lost in the shuffle of the early season – it’s “too soon” for any real conclusions from data and I’m not quite acquainted enough with the team yet (I am a recent Vancouver import, after all) to comfortably analyze them. Soon, though, I think.
Anyway, there is something I can do, and it’s something absolutely nobody has talked about. Did you know the Canucks have TWO really good goaltenders? Have you heard about this? True story. Somehow the media has completely missed the opportunity for rampant trade speculation involving one of these guys, since logic would hold that a team with two great goalies would move one for help elsewhere.
But is that logic correct?
After all, in this shortened season, teams should be relying far more on their back-up tenders than they normally do. In 2011-12, lead goalies appeared in approximately 71.1% of games, but so far this year that percentage has risen to 78.2%. It seems that, in the early going, teams have actually favoured trotting out their top goalie more than usual, which is curious given that teams are playing nearly a game every two days. I’m sure those numbers will balance out by season’s end, though, as goalies wear down and get fatigued.
But that’s not the logic you were talking about.
Right, I was talking about dealing from a position of strength in the net. At first I had thought, “well, it’s a compressed schedule and teams will need two goalies, so the Canucks should hang on to both until the summer.” I still actually believe this, even though the number above and the analysis we’re about to dive into might suggest otherwise.
Now, the Canucks are doing very well. They’re riding a six game winning streak and are 8-2-2 overall, good for the fourth highest points-percentage in the NHL (that is, the percentage of total available points a team gets). They also happen to have the third best save percentage in the league at 93.2%, thanks to stellar marks from Roberto Luongo (94.3%) and Cory Schneider (92.1%).
So, with two high-performing goalies and most teams choosing to ride a single starter so far, you would think there’s good reason to deal one of the goalies, especially since nine teams currently have a save percentage below 90%.
Where you going with this, bruh?
Sorry, I’m getting there. The last key, for me, was to look at recent NHL history and see if team save percentage is crucial to success. If save percentage is a huge factor for regular season team success, it would be reasonable for the Canucks to hang on to both goalies (I’m ignoring the playoffs for simplicity, but the argument including them would be, “you should only use one goalie in the playoffs, so deal one for other help”). That way, if one struggles or gets hurt, there’s a completely reliable Plan B. If one was dealt and save percentage was crucial, that Plan B (a replacement-level back-up) looms as something that could hurt the team.
So I pulled team data from the 2005-06 season to the 2011-12 season. This was actually more difficult than it sounds because NHL stats on the internet are brutal and archaic. There is no “team season finder” like for baseball and basketball, and you can’t even quickly find team save percentage (I had to do a quick calculation step, which seems absurd for such a basic stat). Anyway, the first thing I did was take a look at how a few different factors relate to team win totals (and team point totals).

A brief explanation: “R” refers to the correlation between the variable in the first column (5-on-5 Goals For/Goals Agains, Goals Against/game, etc) and wins or points. “R2” (“R-squared”) shows that the factor in the first column can explain X amount of the variance in wins or points. This is oversimplifying it a bit, but for our purposes that’s all you need to know.
The table is ranked based on correlation with teams wins, which is almost the exact same order as team points. We see that 5-on-5 goals for/against ratio is the only factor with what we’d say is a strong relationship with team wins. Goals against, combined special teams, and goal scoring follow. Save percentage has a pretty weak correlation.
Basically, this table is telling us that hockey is far too complex to break down one or two key factors to predict team success. There are many ways to skin a cat, so to speak.

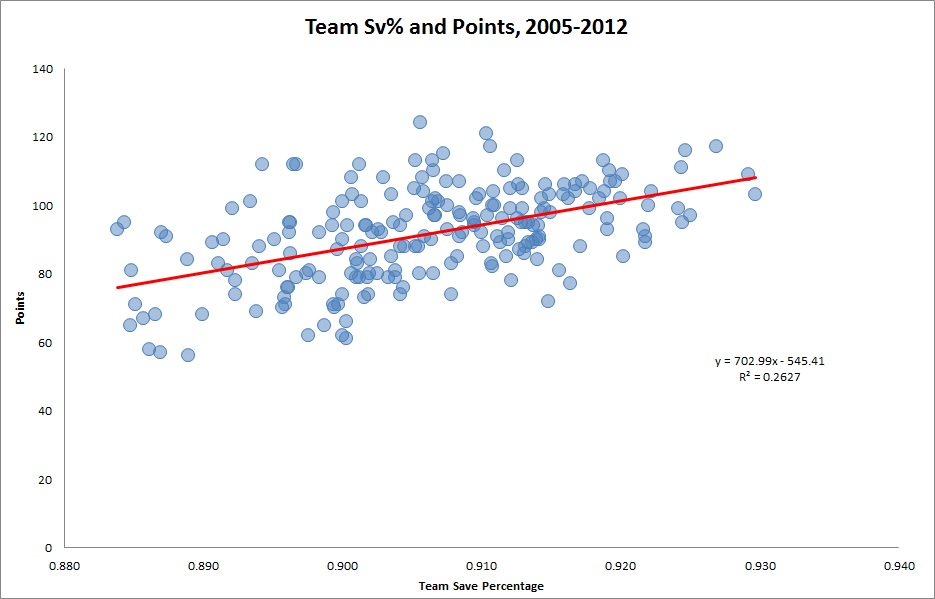
Those graphs just show a plot of all the team seasons from 2005-06 to 2011-12 with team save percentage. It makes plenty of sense that save percentage improves teams, but the weakness of the relationship was a bit surprising to me.
Finally, I made a quick histogram of how often certain save percentage marks are achieved by teams (the bars below) and the average win total for teams in that range (the red line below).

Once again we see the trend from start to finish we would expect, with elite goaltending teams being much better than weak ones. However, that relationship isn’t uniform across the buckets. Basically, if you’re very poor or very elite, there’s a relationship, but taking a step from one bucket to the next doesn’t appear especially important.
The one mark where that isn’t necessarily true is the jump from being in the 90.0% range to getting to the 90.5% area, where production is somewhat two-tiered (see the black lines). So it definitely seems to benefit teams to get into that 90.5% area.
Talk Canucks, Milt.
The Canucks have no worry of falling down into the lower tier of goaltending talent unless they somehow lose Luongo and Schneider. Either Luongo or Schneider as the lead goaltender should have them in a near-elite class, as their career save percentages are 92.0% and 92.7%, respectively.
So, we’ve determined that:
*The Canucks are going to be great in net regardless, unless there’s a trade and then an injury.
*Teams aren’t using their back-ups more, so far, in the shortened season.
*Several teams could use some goaltending help.
*Save percentage doesn’t appear to have much marginal value once teams pass a certain threshold the Canucks will have no problem reaching.
All of this certainly seems to suggest the Canucks would be wise to move one of these goalies.
Maybe I’m just risk averse when it comes to Stanley Cup contenders, or maybe I see the team doing this well with potential additions in Ryan Kesler and David Booth on the way at some point. Maybe I just like both of these goalies too much and can’t see the Canucks getting what I consider a fair return for them. Maybe I did all of this analysis hoping it would show they shouldn’t trade a goalie, and it backfired, and I’m being stubborn. But I’d still hang on to both, avoiding the risk of having to rely on a replacement-level goalie for stints and mitigating any injury risk.
It seems like this is an obvious question to pose to the readers
